Defense Part 1: What do their most frequent matchups tell us about defenders?
Let's take a look at a dataframe built with R about defensive matchups!
Data gathering premise
This week, I tried to analyze some data on player matchups found on the NBA website, looking for interesting information.
The goal was first to gather information from each player's page and then turn it into something easier to analyze and compare.
Once the data was collected, I filtered for each player the matchups that lasted a total of at least five minutes and during which there were at least five shot attempts by the opponent.
Finally, the last major filter was to choose only defenders whose minutes in the chosen matchups added up to at least 50.
The final dataset contains roughly 4000 different matchups for a total of 211 filtered defenders, a figure that roughly matches the rotation players of an NBA season.
As I imagine it is understood, this dataframe does not contain every possession defended by these 211 players; consequently, any defensive numbers covered in this article will not correspond with the totality of the defensive statistics of the players covered, as the goal is more to study the matchups most frequently assigned to a defender.
The final table contains the total minutes and partial possessions spent in the most frequent matchups, the opponent's shots attempted and scored, shots attempted per possession defended, total two-point shots attempted and scored, total three-point shots attempted and scored, the opponent's eFG% in these matchups, the ratio of total two-point and three-point attempts defended, the opponent's assists occurring in these possessions and the number per possession, the number of blocks and steals made by the defender (and figure per possession), and the same for defensive fouls committed.
I would like to emphasize that a player's defensive work cannot be evaluated only by these numbers, both because, as usual, they do not tell the whole story of what happens on the court and because in this specific case they are partial data.
My contribution to the table was as follows: for each matchup among those present, I added for the offensive player the season averages of shots attempted per game, USG%, and TS% (not referring to the matchup, but in general).
From the first value, we can see the offensive activity and how frequently a player shoots, which is a good general index to use to evaluate the importance of a player in the team's offensive system.
The USG% does the same thing, measuring the player's weight in the team's offense in a different way, whereas the TS% evaluates his scoring efficiency.
These are clearly not the only values that can be considered, but they are the ones I chose.
With a weighted average for matchup minutes, we get average values for the opponents that each selected defender has faced, so that we can understand on average what quality or type of opponent is assigned to a defender, what importance he has in his team's defensive system, and how much responsibility he takes on defense.
To give a couple of examples, JJJ faced, on average, opponents who shot 8.2 times per game with a USG% of 17.1% and a TS% of 57.7%, while a perimeter defender like Dort faced players who shot 17.2 times per game with a 27.8% USG and a 58.2% TS%.
It is clear that in general, rim protectors face players with lower USG% and FGA at shooting, so this should not be the only way to evaluate the quality of the assigned offensive matchup.
To better compare these figures, the Z-score comes into play, and it's nerd time to quickly explain what it is.
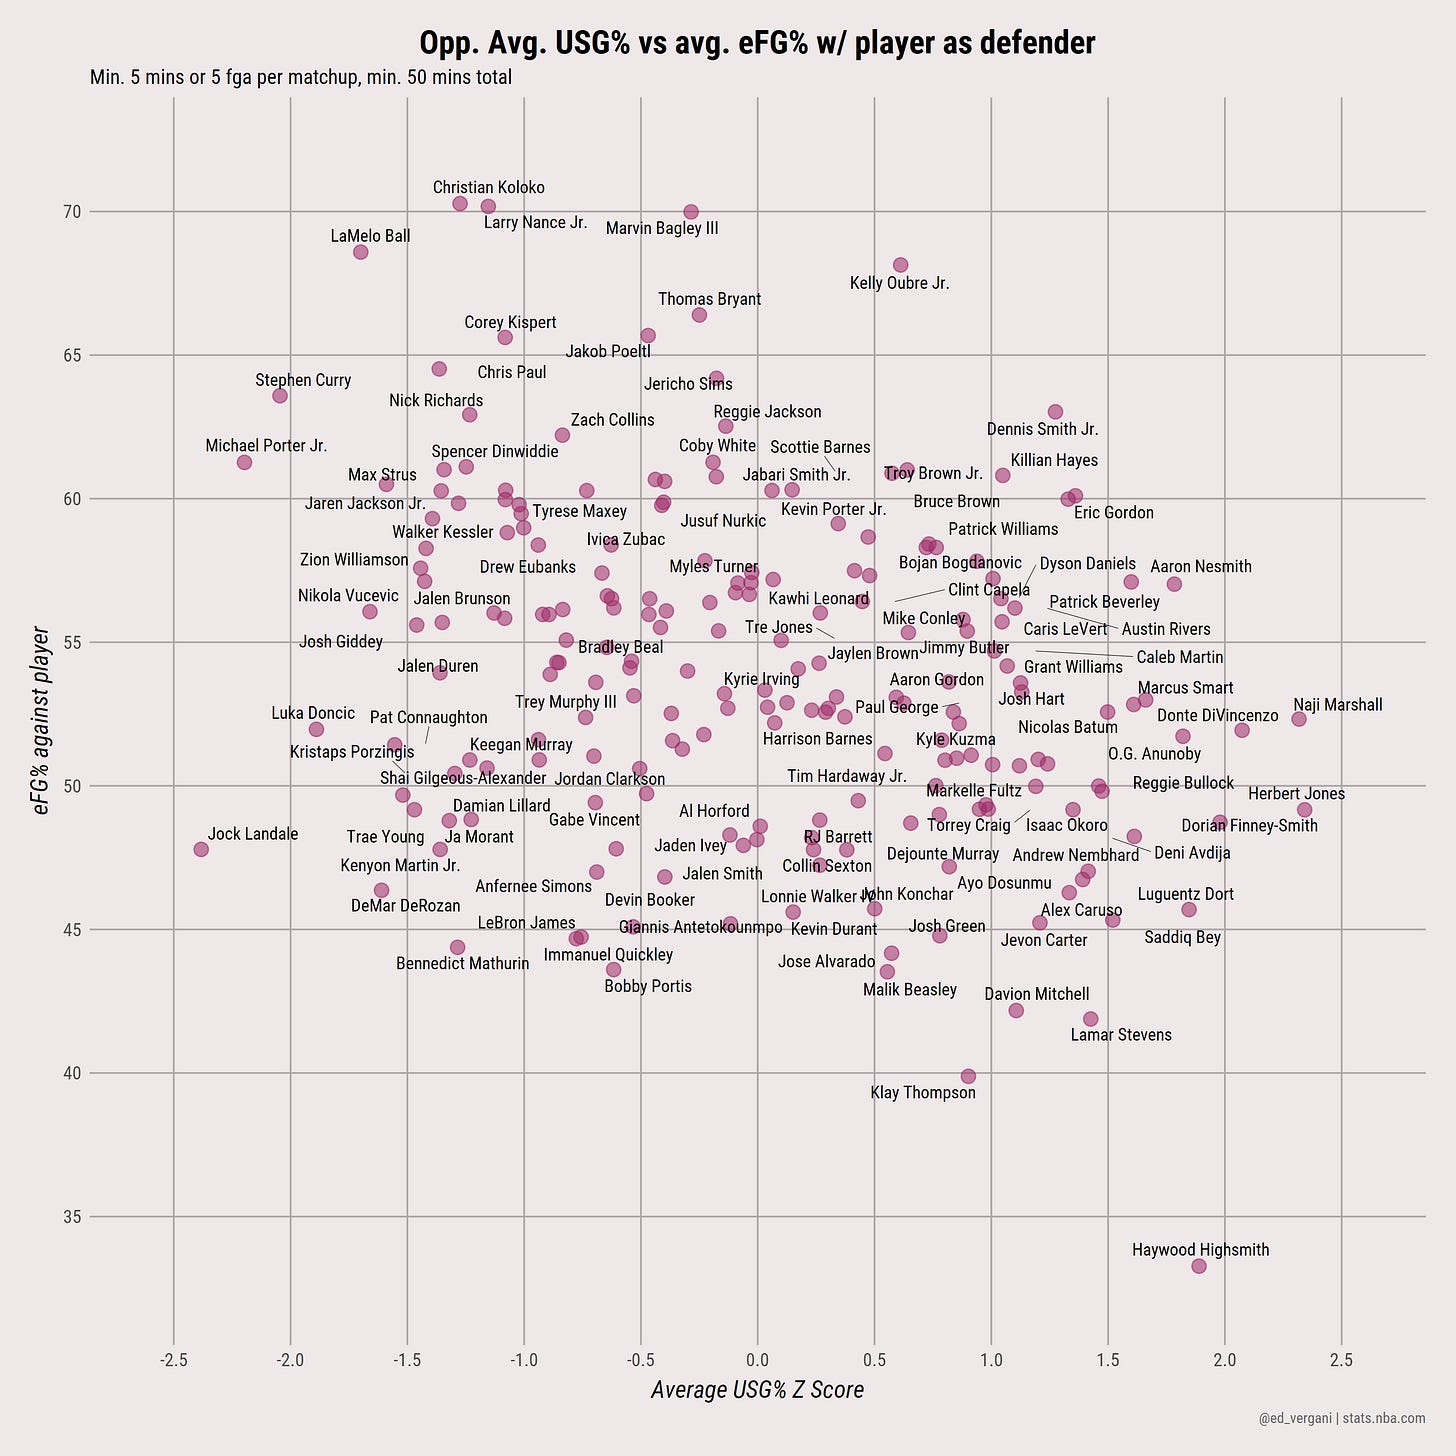
A z-score describes the position of a raw score in terms of its distance from the mean when measured in standard deviation units. The z-score is positive if the value lies above the mean, and negative if it lies below the mean, as in this case with values between about -2.5 and 2.5.
We will have a Z score for the opponent average FGA per game, average USG% and average TS%, in order to understand how the average opponent ranks on these three metrics in the entire NBA for each defender.
The code I used in R to build this will be posted publicly in the future anyway, so that you will also have the full table available!
Let’s talk about the players
Here is a list of defenders facing opponents who have positive Z scores on all three parameters and their opponent's average eFG% in the selected matchups1:
Naji Marshall (NOP), 52.3%
Herbert Jones (NOP), 49.2%
Aaron Nesmith (IND), 57.1%
Haywood Highsmith (MIA), 33.3%
Dorian Finney-Smith (BKN), 48.7%
Patrick Beverley (?), 57%
Alex Caruso (CHI), 46.3%
Reggie Bullock (DAL), 49.8%
Lamar Stevens (CLE), 41.9%
O.G. Anunoby (TOR), 51.7%
Jaden McDaniels (MIN), 52.8%
Dennis Smith Jr. (CHA), 63%
Quentin Grimes (NYK), 53.3%
Austin Rivers (MIN), 56.2%
P.J. Tucker (PHI), 50.8%
Torrey Craig (PHO), 49.2%
Kentavious Caldwell-Pope (DEN), 57.8%
Jrue Holiday (MIL), 50.7%
Jerami Grant (POR), 51%
Grant Williams (BOS), 53.6%
Jeremy Sochan (SAS), 55.7%
Aaron Gordon (DEN), 53.6%
This selection of players is the one in charge of guarding people with high FGA, high USG%, and high TS%, so usually the most threatening opponent, and as we can see, they perform their task more or less well when it comes to contesting a shot.

When it comes to players with all three negative opponent z-scores, the list is too long, so we’ll just look at some of them2:
Jalen Brunson (NYK), 57.1%
Trae Young (ATL), 48.8%
DeMar DeRozan (CHI), 46.4%
Ja Morant (MEM), 48.8%
Tyrese Haliburton (IND), 55.7%
Shai Gilgeous-Alexander (OKC), 49.7%
Spencer Dinwiddie (BRK), 61.1%
Keegan Murray (SAC), 50.9%
Damian Lillard (POR), 49.2%
LeBron James (LAL), 44.7%
James Harden (PHI), 54.3%
CJ McCollum (NOP), 56%
Darius Garland (CLE), 51.6%
D’Angelo Russell (LAL), 54.8%
Donovan Mitchell (CLE), 55.8%
Anfernee Simons (POR), 47%
Bobby Portis (MIL), 43.6%
Zach LaVine (CHI), 50.9%
Giannis Antetokounmpo (MIL), 45.1%
This tells us that these players are usually not in charge of defending the most dangerous scorer, and some of them do a terrific job, being in the top 10 for opponent eFG%.

Let’s have a look at two players from DPOY Ladder
Brook Lopez
Lopez's defensive growth over the years has been one of the reasons the Bucks still remain a major title contender, and this year the numbers are generally on his side for DPOY.
In our case, in the 312 minutes and 1,600 possessions he spent in key matchups, he faced, on average, players with high TS% but who attempt few shots per game: he faced 0.24 shots per possession, one of the highest values in the sample, though, for a total of 386 with a very good opponent eFG% of 53.9%, among the best five among same-role players.
Add to that 0.016 blocks per possession, 10th best value in the table, and a below-average number of shooting fouls.
Based on the analysis, and given the large sample of possessions faced, his run at DPOY is certainly plausible.
Jaren Jackson Jr.
Jaren Jackson also has a similar matched-up player profile to Lopez, the difference being that his opponent on average has a lower TS% at 57.5%.
With 0.18 shots attempted per possession over the course of 552 possessions against the most faced opponents, the opponent's eFG% against him is 59.3%, which is not an excellent value among peers.
In any case, numbers also tell a lot about the possessions in which the opponent does not get a shot off, with 0.018 blocks p.p. (6th best value) and 0.024 steals p.p. against only 0.009 fouls p.p ., all largely positive values.
I will definitely use this table for future analysis, also trying to add more possible parameters to analyze the defensive matchups in the best possible way.
Players in bold have an opponent eFG% below 50%.
Players in bold have an opponent eFG% around or above 56%.


