


Record-breaking season: 45 lineups score 50+ threes for the first time!
It was about time.

This season, history was made!
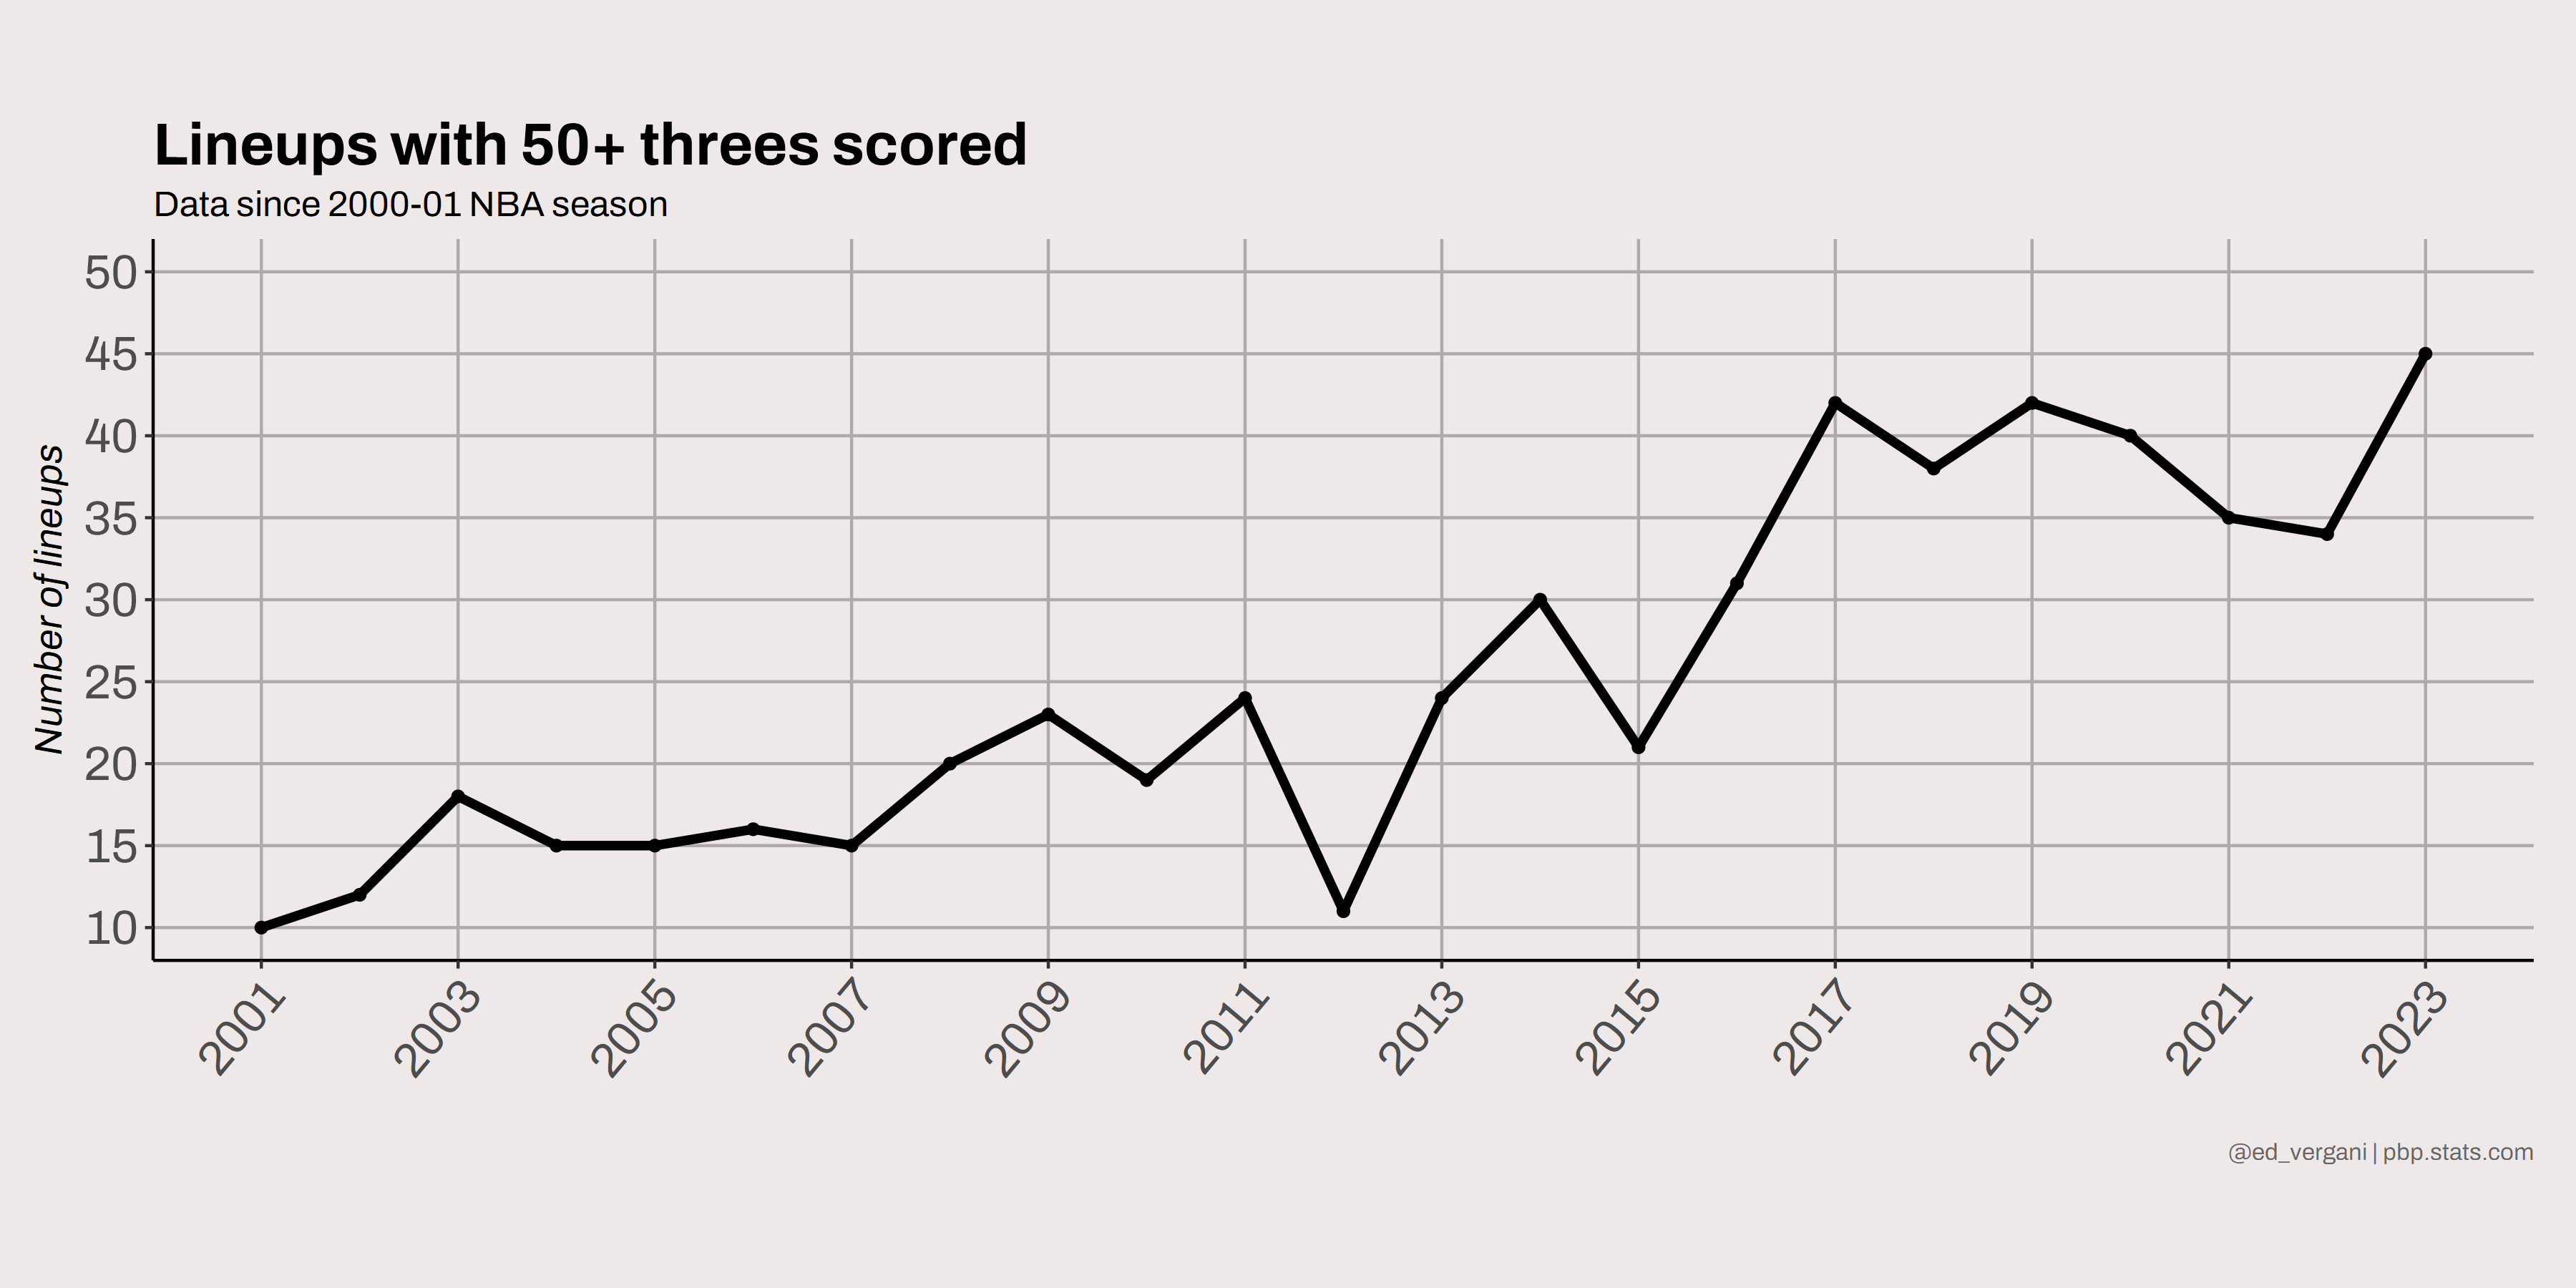
With five days to go until the end of the 2022–23 regular season, there have been 45 individual lineups capable of making at least 50 threes over the course of the season: in 2001, there were 10, and until 2014, the threshold of 30 lineups was never surpassed, and up until 2017, the figure was 40.
With the 2015-16 and 2016-17 seasons, we have definitely entered the era of the three-point shooting explosion, led by two-time MVP Stephen Curry and his Warriors, capable under Kerr's guidance of completely transforming the league. With this year, perhaps a further step in the offensive efficiency of teams has been reached, but only time and the next season will be able to confirm or deny this growth.
What is certain is that of the 580 lineups capable of scoring at least 50 triples in the 21st century, about 340 did so after the 2013–14 season.
The lineup that has scored the most threes this season is from the Kings, consisting of Sabonis, Fox, Huerter, Murray, and Barnes: 241 triples in 876 minutes, or about 9.9 triples per 36 minutes (the 131st value of the century) at 35.65 percent.
Not surprisingly, it is this small lineup coached by Mike Brown that has the most triples, partly by virtue of the many minutes played together by a particularly injury-lucky team, the 50th highest value among all lineups chosen since 2000-01 (580).
Despite not being particularly efficient at shooting, the type of players and the amount of minutes allowed this lineup to be the one with the highest number of triples on the season.
However, the Kings also manage to have another lineup this year capable of surpassing 50 treys, and significantly more efficiently: Sabonis, Huerter, Mitchell, Murray, and Barnes, who made 98 triples in 263 minutes.
This lineup shoots 46% from three-point range and averages 13.41 triples per 36 minutes.
Replacing Fox with a rather similar shooter in terms of percentages seems to have made the team more efficient at shooting, albeit with significantly fewer minutes.
As far as efficiency is concerned, however, the crown goes to a lineup we will realistically never see on the court again, flaking off at the trade deadline: we are talking about Doncic, Hardaway, Dinwiddie, Powell, and Finney-Smith.
For the Texans, this is the second-most efficient lineup of the millennium at three-point shooting, with 15.36 threes scored per 36 minutes, at 46 percent.
Dallas also surprises on the other side of the coin, having deployed the lineup with the worst three-point shooting percentage of the season among those selected: out Finney-Smith, in Wood.
For this five-man lineup, 52/163 in 198 minutes is good for 32 percent from three and 9.45 threes per 36 minutes. As of today, this lineup can be repurposed with Irving in Dinwiddie's place, but so far it has seen the court for only 3 minutes.
Before going through some past lineups, let's look at the five lineups with the highest and lowest values of threes scored per 36 minutes among those this season:
The aforementioned Dallas lineup, 15.36/36;
Curry, Thompson, Wiggins, Green, Looney: 14.46/36;
Sabonis, Huerter, Mitchell, Murray, Barnes: 13.41/36;
Brown, Tatum, White, Horford, Smart: 13.16/36;
Turner, Hield, Nembhard, Haliburton, Nesmith: 12.63/36.
Whereas those with the worst values:
Russell, Towns, Edwards, McDaniels, Gobert (not existing any more): 7.2/36;
Murray, Collins, Young, Hunter, Capela (bad news..): 7.26/36;
Porter Jr., Green, Martin Jr., Sengun, Smith Jr.: 7.44/36;
Adebayo, Martin, Herro, Lowry, Butler (same probably): 7.63/36;
Poeltl, Siakam, VanVleet, Anunoby, Barnes (part three): 7.66/36.


What about the last twenty years?
Looking at this chart, it is easy to see how the teams that were scoring from three most frequently in the early 2000s would be largely among the worst today: the number of lineups has grown by leaps and bounds, and so has the efficiency with which these lineups have come to score and surpass the fifty-three mark.
As for the average number of triples per 36 minutes, the upward trend seems to have stopped in recent seasons, after nearly two decades of consecutive “Morey-Ball” growth.
In 2000-01, the league’s best Magic's lineup of McGrady, Mike Miller, Darrell Armstrong, Bo Outlaw, and Andrew DeClerq scored 6.61/36 triples, which is lower than the lineup seen before by the Timberwolves, the worst value this season.
In return, however, the McGrady-led lineup was scoring at a 43.7 percent rate from three-point range.
Among the higher values recorded, it immediately jumps out in 2012 how there were two lineups, with one in particular far superior, capable of scoring tiple with a frequency considered good even by contemporary standards:
JJ Redick, Ryan Anderson, Hedo Turkoglu, Dwight Howard, Jameer Nelson: this five-man lineup by the Magic scored 11.73/36 (224 minutes) with a very good percentage of 45.3%.
Anderson, Turkoglu, Jason Richardson, Howard, Nelson: still a Orlando Magic’s lineup, recording 9.3/36 and 38.7% from three.
There are four lineups in 2016 that break away from an average that is already beginning to rise considerably, all of them deployed by the Warriors:
Curry, Thompson, Barnes, Green, Iguodala: the best of the millennium. For this five-man squad, 16.11/36 and 53.4% from three, 77 triples in just 172 minutes.
Bogut, Curry, Thompson, Green, Iguodala: 156 minutes, 62 threes, corresponding to 14.3/36 and 50.4% from three.
Bogut, Rush, Curry, Thompson, Green: 254 minutes, 87 threes, or 12.33/36 and 43.2%. Percentage from three down with the inclusion of Brandon Rush, despite a 41.4% three-point season of his own.
Bogut, Curry, Thompson, Barnes, Green: 552 minutes, 168 threes. 10.96/36 and 38.5% from three.
Two more interesting figures in 2018, with two Rockets lineups led by peak James Harden:
CP3, Ryan Anderson, Harden, Capela, Ariza. For this lineup 187 minutes and 76 triples, equivalent to 14.63/36 and 47% from three.
Eric Gordon, Anderson, Harden, Capela, Ariza. 217 minutes, 79 threes: 13.1/36 and 38% from three.
In 2019 it is of course Golden State's death lineup that leads NBA lineups in triples per 36 minutes: the figure is 14.35/36, 47.8% and 71 triples in 178 minutes.
Yay! Rankings!
We then conclude with the five worst lineups of the 21st century for this statistic among those capable of scoring at least 50 triples over the course of a season:
Andre Miller, Samuel Dalembert, Reggie Evans, Willie Green, Andre Iguodala (PHI, 2008): 2.27/36 and 38.2%. For them only 144 triples attempted in 872 minutes.
Andre Miller, Nene, Carmelo Anthony, Voshon Lenard, Marcus Camby (DEN, 2004): 2.27/36 and 34.6%. 62 successful threes in 982 minutes.
Andre Miller, Thaddeus Young, Samuel Dalembert, Willie Green, Andre Iguodala (PHI, 2009): 2.43/36 and 33%. 53 triples in 784 minutes together.
Kenyon Martin, Richard Jefferson, Jason Collins, Jason Kidd, Kerry Kittles (NJN, 2004): 2.64/36 and 31.8%: only 75 threes in 1022 minutes.
Deron Williams, Andrei Kirilenko, Raja Bell, Paul Millsap, Al Jefferson (UTA, 2011): 2.64/36 and 31.2%: 55 triples in 749 minutes.
As for three-point shooting percentages, here are the top five:
Curry, Thompson, Barnes, Green, Iguodala (GSW, 2016): 53.47%;
Ball, Javonte Green, DeRozan, Vucevic, LaVine (CHI, 2022): 50.48%;
Bogut, Curry, Thompson, Green, Iguodala (GSW, 2016): 50.40%;
Antoine Wright, Dirk Nowitzki, Josh Howard, Jason Kidd, Erick Dampier (DAL, 2009): 50.0%;
Zubac, George, Marcus Morris, Leonard, Jackson (LAC, 2021): 48.90%.
And of course the worst five:
David Wesley, P.J. Brown, Baron Davis, Jamaal Magloire, George Lynch (NOH, 2004): 26.81%;
Shai, Bazley, Dort, Robinson-Earl, Giddey (OKC, 2022): 26.82%;
Felton, Speights, Johnson, Rivers, Crawford (LAC, 2017): 28.65%;
Antawn Jamison, Larry Hughes, Brendan Haywood, Gilbert Arenas, Jared Jeffries (WAS, 2005): 29%;
Kuzma, Gafford, Beal, Caldwell-Pope, Dinwiddie (WAS, 2022): 29.10%.
It will be interesting to see if after such an incredible offensive season as the one that is about to end, next year we will be able to surpass the milestone of 50 different lineups capable of scoring at least 50 triples: undoubtedly, it will also depend a lot on the availability of the players throughout the season.
In this other article, you can find the tutorial to replicate this plot and to scrape the data I’ve used from pbp.stats.com with R.
